


.jpg)


.jpg)


American, Delta, And United Profitability Divide: What’s Driving It?
Among the ”big three” US carriers — American, Delta, and United — there’s significant variance in terms of profitability. Delta has long been the most profitable, while American has long been the least profitable. United has been transforming itself in recent years, and went from being in American’s league, to being in Delta’s league.

Among the “big three” US carriers — American, Delta, and United — there’s significant variance in terms of profitability. Delta has long been the most profitable, while American has long been the least profitable. United has been transforming itself in recent years, and went from being in American’s league, to being in Delta’s league.
There’s often discussion about all the things that Delta does right, and all the things that American does wrong, given their vastly different financial performance. However, what’s actually driving this difference in performance? Is Delta really transporting passengers that much more profitably, or what’s going on? I think the results might surprise some people…
The surprising reality of American vs. Delta vs. United
Looking at full year financial results for 2024, American, Delta, and United:
- American reported operating income of $2.6 billion, and net income of $846 million
- Delta reported operating income of $6.0 billion, and net income to $4.7 billion
- United reported operating income of $5.1 billion, and net income of $4.2 billion
That’s obviously quite a range. I think the average person would assume that this means that Delta transports passengers a lot more profitably than American and United. While this doesn’t tell the full story, I’m a big fan of looking at PRASM, TRASM, and CASM, since it’s a fun, easy thing to compare.
For those not familiar:
- Passenger revenue per available seat mile (PRASM) tells you how much passenger revenue an airline is getting for every seat mile flown, regardless of whether it’s full or not
- Total revenue per available seat mile (TRASM) includes not just the passenger revenue, but also cargo revenue, revenue from ancillaries, etc.
- Cost per available seat mile (CASM) tells you the average cost an airline incurs for each seat mile flown, whether there’s someone in that seat or not
So, how do those numbers compare at American, Delta, and United, for 2024?
Looking at American’s financial results:
- Passenger revenue per available seat mile was 16.93 cents
- Total revenue per available seat mile was 18.51 cents
- Cost per available seat mile was 17.61 cents
Looking at Delta’s financial results:
- Passenger revenue per available seat mile was 17.65 cents
- Total revenue per available seat mile was 21.37 cents
- Cost per available seat mile was 19.3 cents
Looking at United’s financial results:
- Passenger revenue per available seat mile was 16.66 cents
- Total revenue per available seat mile was 18.34 cents
- Cost per available seat mile was 16.7 cents
You’ll probably notice some interesting things here:
- At all three airlines, PRASM is lower than CASM, meaning that airlines aren’t breaking even on their costs exclusively from selling tickets for transporting passengers; United is the closest to breaking even with PRASM vs. CASM
- United has the lowest PRASM, TRASM, and CASM, but that reflects that the airline has a much larger long haul network, where you expect those numbers to be lower; for example, United’s average stage length is 1,475 miles, while American’s is 851 miles
- It’s not surprising to see Delta have the highest CASM, given that the airline has a rather outdated and fuel inefficient fleet, the highest paid employees (on average), and doesn’t operate as many long haul flights as United
- If you take PRASM and compare it to CASM, you’ll find that United has the best performance, followed by American, followed by Delta
- If you take TRASM and compare it to CASM, you’ll find that Delta and United are roughly tied with their performance, and American is way behind
What’s driving the difference in profitability?
Based on 2024 results, United is the closest to directly breaking even on transporting passengers, while Delta is the furthest from breaking even on transporting passengers. So, how is Delta able to be the most profitable airline, despite that reality? And why is American so far behind Delta and United when it comes to profitability?
This is where it’s interesting to dig into other aspects of airline performance. A few things stand out:
- American has the most modern fleet, but that also translates to lots of interest expenses (debt), while Delta (probably smartly) largely flies older aircraft; in 2024, Delta paid $747 million in interest expenses, United paid $1.6 billion, and American paid $1.9 billion
- While American and Delta are largely “up to date” on their labor contracts, United still has a long way to go there, so the airline has significant cost savings from not having finalized contracts with flight attendants, for example, and that will eat into profitability in the future
- Delta is unique among the “big three” US carriers in owning an oil refinery, though the profitability of that varies greatly by year; in 2024, that generated $4.6 billion in revenue
- United has a major advantage with cargo, given how global its route network is; in 2024, United generated around $1.7 billion in revenue from cargo, while American and Delta generated around $800 million each
- Delta is also really good at generating revenue from its loyalty program, including with its co-brand credit card agreement, plus Sky Club access agreement with Amex; in 2024, American generated $6.1 billion in revenue from AAdvantage, while Delta generated $7.4 billion from SkyMiles
What’s my point in saying all of this?
What’s the moral of the story with all of this? After all, it’s the bottom line that counts, and it’s pretty clear who is winning (and losing) there.
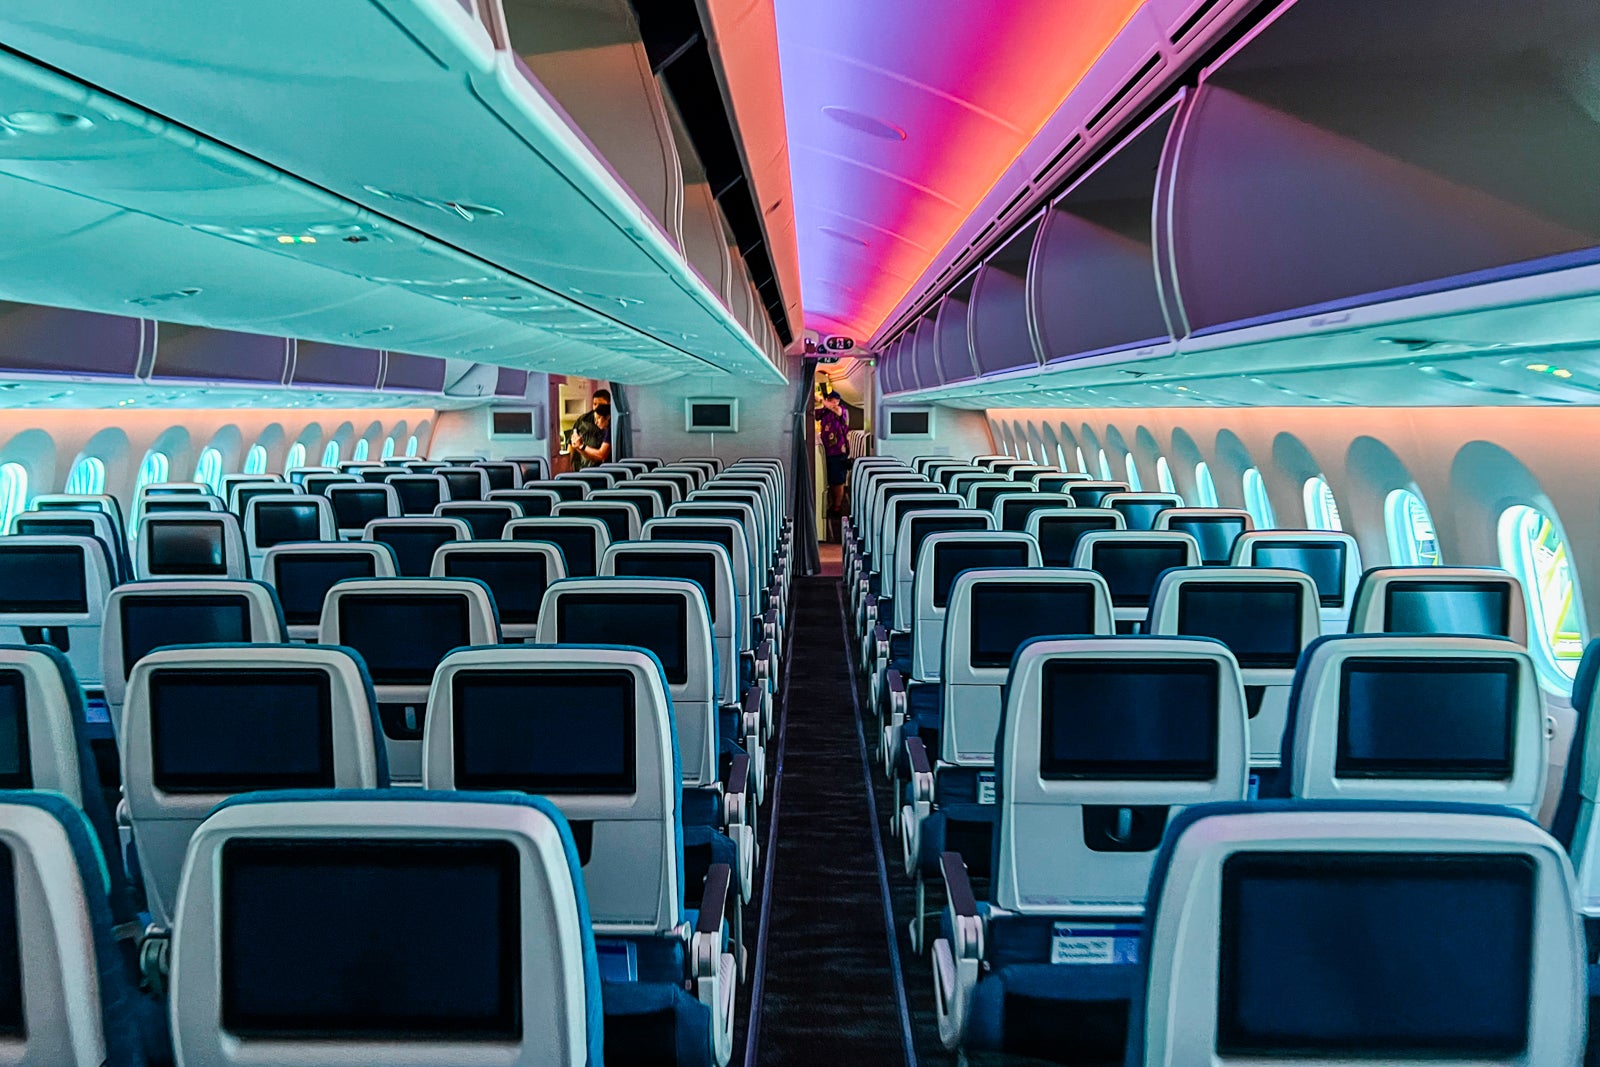
My point is simply to point out the complexity of the industry. I’m as guilty of this as anyone, but the reason American is less profitable than Delta and United probably isn’t primarily because it’s less “premium,” and doesn’t have seat back TVs. Instead, there are so many other factors at play.
Ultimately Delta is profitable due to a combination of factors, including that it has less debt than American, it owns an oil refinery, and it generates a killing on its SkyMiles program and its Amex lounge access agreements. Yeah, Delta gets a little more revenue per available seat mile, but it also has higher operating costs, due to having less fuel efficient aircraft, and higher labor costs.
United also has some unique circumstances. Comparing United’s profitability right now really isn’t apples-to-apples, given its labor cost advantages. For the time being, the airline is closest to actually making money transporting passengers, though.
I also think United probably has the most upside with its loyalty program, as the airline increasingly gets a loyal following due to its global route network that’s popular with premium leisure travelers, and increasingly offers elite status for credit card spending, where it lagged American and Delta.
Bottom line
We all know that among the “big three” US carriers, Delta is most profitable, followed by United, followed by American. However, it’s not necessarily exclusively for the reasons that people assume. None of the airlines are particularly good at making money from transporting passengers, but instead, they make money with everything else.
What’s interesting is the relative advantages that each of the airlines have (well, American doesn’t have many advantages, but Delta and United do). Delta has an oil refinery and makes the most with its loyalty program, while United makes the most from cargo, and has a labor advantage, among other things.
What’s your take on the profitability divide between the “big three” US carriers?